
Skip to content
SIAT PAPER 2026 — Open the research page
Cryptoverso

GEA: where the market actually traded

The volume traded at every price, bar by bar.

Shows you where

coming soon
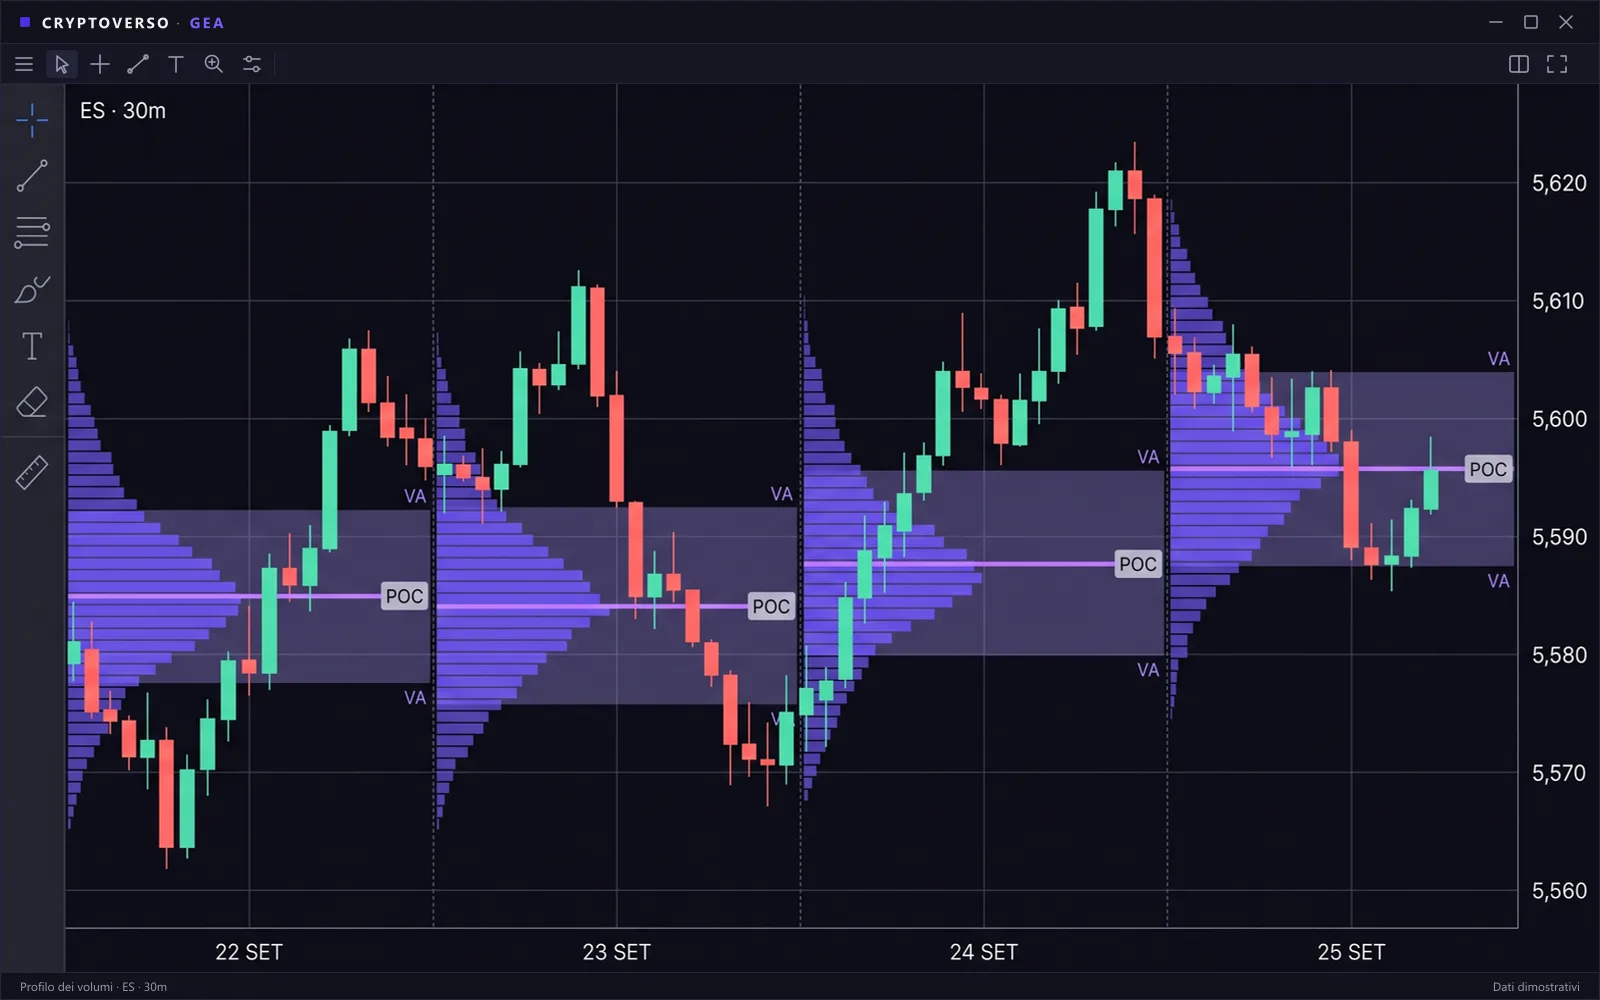
Reconstructed interface of GEA: volume by price profile next to the chart, with value area and point of control.
GEA: where the volume traded.

What it reads in volume

Volume profile

What traded at each price.

Value area

The most traded level and its edges.

Rolling or session

Two windows, same count.

Two volume-by-price profiles side by side on the same price scale: on the left the latest bars of a rolling window, on the right the whole session. The most traded level, marked in amber, sits at two different heights; the other bars shift from blue to green as volume grows.

Same market, two windows: the most traded level moves with the way you count it.

Research already done

Volume, before it becomes an indicator

  • Put to the test: how volume per price is counted when the window changes, rolling or per session.
  • The tool measures; reading the chart stays yours.
  • The copilot builds tools; research takes years.

Launch and price

Volumes add-on, yearly

coming soon

price being set

  • Mounts on the Workstation base
  • With a bundle you do not need it separately: it is already inside Two modules · Everything included · Everything included + Algo.
  • Prices are set when the platform launches: people on the waiting list get them first.

Without JavaScript

With JavaScript off you can read and fill in this form, but not send it: the anti-spam check that protects our address can’t run without it. That’s our choice, not a fault. Write to us at info@cryptoverso.net: we read everything.

What it does today

  • Any market that produces ticks.
  • Active service on the platform.

What it doesn’t do

  • Non-crypto data: you connect it.

Where the reading stops

  • It runs on your own data.
  • The outcomes stay yours.
  • Automatic orders: planned, after the legal opinion.